Contents
- Executive Summary: Why Utilization Is the Profit Lever
- What Is Real-time GPS Asset Tracking?
- Fleet Utilization 101
- Seven Ways GPS Tracking Boosts Utilization
- Building the ROI Model
- Integrations That Matter
- Compliance, Privacy & Data Governance
- Industry Use Cases
- Dashboards & Alerts: What to Review Weekly
- Common Pitfalls (and How to Avoid Them)
- Vendor Selection Checklist
- What’s Next: AI, Video Telematics, 5G & Edge IoT
Executive Summary: Why Utilization Is the Profit Lever
Fleet utilization is the single biggest multiplier on operating margin. When vehicles, trailers, and high-value equipment spend more of their available time doing paid work – and less time idling, dwelling, or running empty – cost per job drops and revenue per asset climbs. Real-time GPS asset tracking turns location and telemetry into immediate action: cut idle, tighten routes, right-size capacity, prevent theft, and schedule maintenance before failures happen. The compounding effect is higher service levels, safer operations, and faster payback than most capex projects.
What Is Real-time GPS Asset Tracking?
At its core, GPS asset tracking is a sensor-to-cloud system that continuously reports where assets are, how they’re being used, and whether they’re on plan.
Core Components: Devices, Connectivity, Platform, Data
- Devices: Hard-wired trackers for powered assets; OBD-II/12V plug-ins for light duty; solar/battery trackers for trailers and equipment; Bluetooth beacons for small tools.
- Connectivity: LTE/5G for metro corridors; LPWAN (Cat-M1/NB-IoT) for long battery life; satellite as a backstop for remote regions.
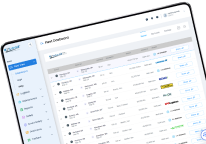
- Platform: Web and mobile apps with live maps, dispatch, geofencing, maintenance, and analytics; role-based access and APIs for integration.
- Data: GPS coordinates, speed/heading, engine hours and ignition state, fuel/fault codes (via CAN/ECU), door and temperature sensors, PTO/auxiliary inputs.
How It Works End-to-End (Ping → Cloud → Insight → Action)
- Ping: The device records a position/telemetry sample at a set interval or on events (ignition on, geofence enter/exit).
- Transport: Data is encrypted and sent over cellular/LPWAN/satellite to the cloud.
- Processing: The platform enriches raw pings with traffic, maps, and geofence logic; rules engines flag exceptions.
- Insight: Dashboards, alerts, and reports surface what matters: excessive idle, route deviations, dwell bottlenecks, upcoming maintenance.
- Action: Dispatch resequences stops, managers coach drivers, maintenance opens work orders, customers receive live ETAs.
Fleet Utilization 101
Definitions & Formulas (Time-based, Mileage, Turns, Load Factor)
- Time-based utilization (%):
Utilization = (Active time (driving/working) / Available time) ×100
- Mileage efficiency: Revenue miles ÷ total miles.
- Asset turns: Number of completed jobs/loads per period.
- Load factor: Actual payload ÷ capacity (weight or cube).
Benchmarks by Fleet Type & Duty Cycle
Linehaul, regional, last-mile, heavy equipment, and field service fleets each have different “good” ranges. What’s universal: visibility closes the gap between best and average performers within the same operation.
The Hidden Cost of Idle & Dwell
Idle burns fuel and warranty life without producing revenue; dwell at yards and customer sites cascades into missed windows and overtime. Without telemetry, these losses hide in averages; with it, they’re measurable and correctable.
Seven Ways GPS Tracking Boosts Utilization
1) Reduce Idle & Dwell Time
Live ignition status and per-site geofences reveal exactly where and when idle/dwell spikes. You can set targeted policies (e.g., 3-minute idle cap in yard; 7 minutes at dock) and redesign site flow to keep assets moving.
KPIs: Idle %, Dwell by Site, Fuel Burn at Idle
- Idle hours ÷ engine hours
- Median and 90th-percentile dwell per site/stop type
- Fuel burn per idle hour and total idle fuel cost
2) Optimize Routing & Dispatch in Real Time
Real-time location plus traffic and service windows lets dispatchers assign the nearest available asset, resequence stops, and avoid choke points. Historical route replay exposes chronic inefficiencies you can eliminate.
KPIs: On-time %, Miles/Stop, Route Deviation
- Planned vs. actual arrival variance
- Miles per stop and deadhead miles
- Average route adherence score
3) Improve Asset Allocation & Backhaul Planning
Utilization heatmaps show where equipment is under-used. Rebalance capacity across regions and secure backhauls to turn empty returns into revenue.
KPIs: Asset Turns, Load Factor, Empty Miles
- Loads per trailer/tractor per week
- Average load factor by lane/customer
- Empty/ghost miles as a share of total
4) Predictive Maintenance & Uptime
Condition-based maintenance using engine hours, fault codes, and temperature prevents roadside failures and smooths shop scheduling. The result is more available hours per asset.
KPIs: MTBF, Unplanned Downtime, Cost/Asset
- Mean time between failures
- Unplanned shop hours per month
- Maintenance cost per asset per mile/hour
5) Coach Driver Behavior & Safety
Harsh events (brake/accel/corner), speeding, and idling roll up to a driver scorecard. Positive coaching reduces incidents, fuel burn, and wear – all of which raise utilization.
KPIs: Harsh Events/1k mi, Speeding Minutes, Incident Rate
- Events per 1,000 miles
- Time above threshold speeds
- Preventable incident frequency and claims cost
6) Theft/Loss Prevention with Geofencing
After-hours movement alerts and high-risk zone warnings speed recovery and deter theft. Recovering a trailer or excavator within hours avoids rentals, schedule slips, and replacement capex.
KPIs: Recovery Time, Incidents, Insurance Savings
- Median time from alert to recovery
- Theft attempts vs. successful thefts
Premium reductions and deductible avoidance
7) SLA Compliance & Accurate Customer ETAs
Share secure, view-only tracking links or automated ETA texts. Better arrival precision reduces detention, dwell, and “Where is my order?” calls.
KPIs: SLA Hit Rate, ETA Variance, Dock Wait Time
- SLA compliance % by customer/tier
- Absolute ETA error (minutes)
- Average dock wait and detention fees
Building the ROI Model
Inputs & Assumptions (Fuel, Labor, Insurance, Loss)
Start with four buckets: idle fuel, routing/empty miles, downtime, theft/insurance. Add program costs (hardware, install, subscriptions, training) and quantify benefits with conservative deltas.
Sample Before/After Calculation & Payback
- Idle reduction, e.g., 25–35% of current idle fuel spend
- Route efficiency, e.g., 2–5% miles saved on targeted lanes
- Downtime reduction, e.g., 15–25% fewer unplanned hours
- Loss prevention, e.g., higher recovery rate → lower net loss
Sum annual savings, subtract program cost, compute ROI and months to payback. Because savings accrue daily, most fleets see meaningful payback within a single quarter when the rollout targets high-impact use cases first.
Integrations That Matter
TMS/Dispatch, ELD/HOS, CMMS, ERP/Finance, Fuel Cards
- TMS/Dispatch: Assign nearest asset, verify stop sequence, push live ETAs.
- ELD/HOS: Align hours-of-service with GPS truth to avoid violations.
- CMMS: Auto-create work orders from engine hours or fault codes.
- ERP/Finance: Attribute cost and margin by lane/customer.
- Fuel Cards: Reconcile swipes to GPS to curb misuse.
Data Layer: APIs, Webhooks, Data Lake
Choose platforms with open APIs and event webhooks so data flows both ways. Land raw telematics in a data lake to build custom dashboards, reports, and ML models later.
Compliance, Privacy & Data Governance
Policy, Consent, BYOD
Publish what data is collected, why, who can access it, and for how long. For mobile apps on personal devices, require opt-in and separate personal from work profiles.
Retention, Security, Audit Trails
Keep raw location data only as long as business and legal needs require; aggregate beyond that. Enforce SSO/MFA, role-based access, encryption at rest/in transit, and log every view/edit for auditability.
Industry Use Cases
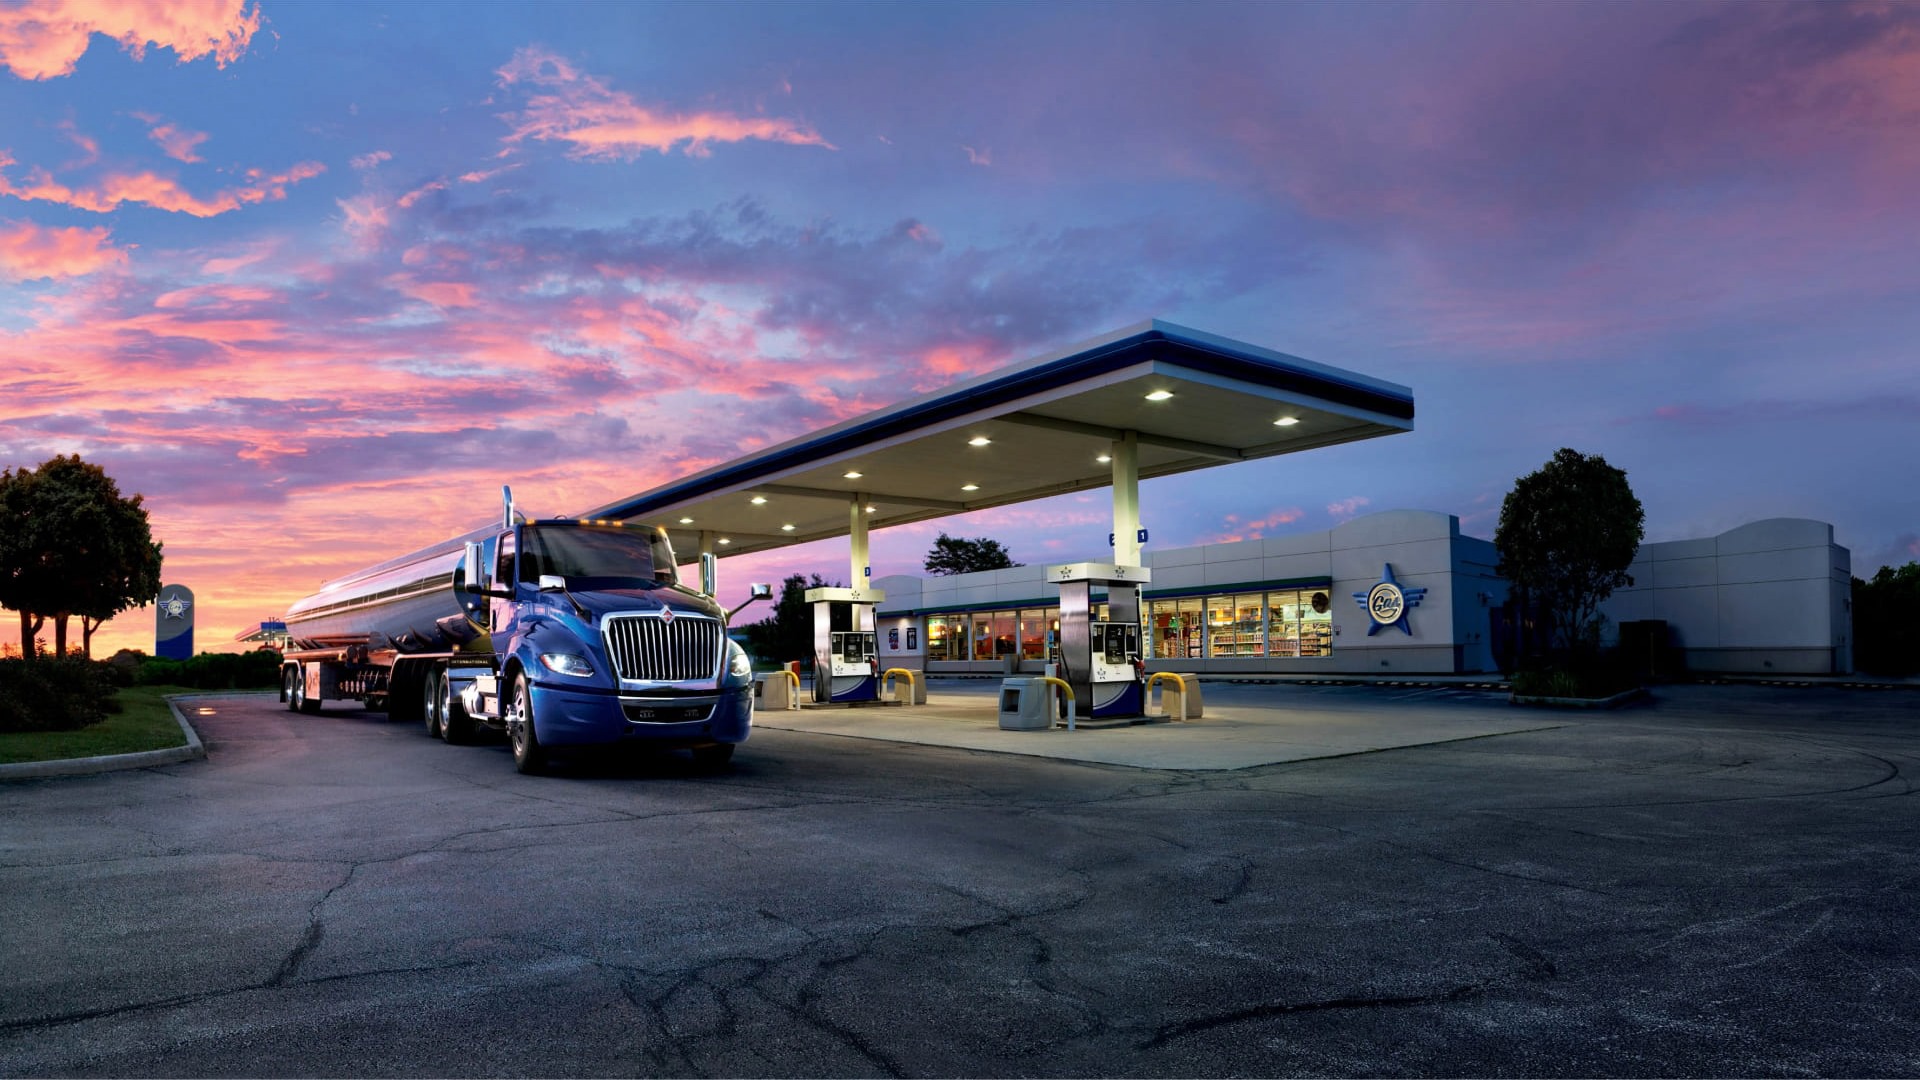
Trucking & Logistics
Reduce empty miles and detention with live ETAs and appointment adherence. Improve trailer turns and yard visibility to support tighter SLAs.
Construction & Heavy Equipment
Solar trackers on trailers, compressors, and generators expose under-utilized assets; redeploy before renting. Geofences deter theft and accelerate recovery.
Field Services & Utilities
Live location shortens dispatch-to-arrival times and allows dynamic resequencing, adding same-day jobs without adding trucks.
Cold Chain & Temperature-Controlled
Combine GPS with temperature and door sensors to protect loads and document custody for audits and claims.
Dashboards & Alerts: What to Review Weekly
Executive Scorecard vs. Ops View
- Executive: Utilization %, on-time %, idle %, empty miles, revenue per asset, downtime hours, theft incidents.
- Ops: Dwell by site, route deviation, harsh events, overdue PMs, device health/last-seen.
Noise-Proof Alerting (Thresholds & Escalations)
Limit alerts to actions someone will take: idle > X minutes (by site type), ETA slip > Y minutes on priority customers, after-hours movement, maintenance due in Z hours. Review alert volume monthly and tune thresholds to prevent fatigue.
Common Pitfalls (and How to Avoid Them)
Over-tracking, KPI Sprawl, Data Quality
Don’t measure everything and move nothing. Select a handful of KPIs that map to dollars, and enforce data hygiene (device install QA, heartbeat checks, calibration).
Device Health & Install QA
Track device last-seen, battery state, GPS signal, and sensor hookups. Maintain an install checklist and a weekly device-health report to keep the data trustworthy.
Vendor Selection Checklist
Coverage, Accuracy, Update Rate, Battery Life
Verify performance in your lanes and sites, including rural and indoor scenarios. Match update frequency to battery life and duty cycles.
SLAs, Support, Security, Total Cost of Ownership
Demand clear SLAs, RMA processes, and install support. Validate SSO/MFA, encryption, and audit logs. Compare TCO across hardware, install, subscriptions, integrations, and data egress.
What’s Next: AI, Video Telematics, 5G & Edge IoT
Expect AI-assisted dispatch that predicts ETA slips, recommends backhauls, and pre-flags maintenance. Video telematics will auto-coach risky behaviors. 5G and edge computing will move more decision-making from the cloud to the vehicle and yard, shrinking reaction time from minutes to seconds.
Conclusion
Real-time GPS asset tracking converts dots on a map into better decisions every hour of every day. Reduce idle and dwell, eliminate wasted miles, keep assets healthy, prevent loss, and deliver on time. The utilization lift shows up quickly in fuel, labor, and maintenance lines – and compounds as you scale.
Next step: baseline your KPIs, launch a 60–90 day pilot on 25–50 assets, review results weekly, then roll out with the playbook that worked.
FAQ
1) Do we need engine-connected devices for every asset?
Not always. Use engine-connected units for powered vehicles (richer data like idle and fault codes) and solar/battery trackers for trailers and equipment. Most fleets run a mix.
2) How accurate are GPS locations and ETAs?
Modern devices routinely deliver sub-10-meter accuracy. ETA accuracy depends on update rate, traffic data, and route models; configure update intervals by duty cycle.
3) What about driver privacy?
Publish a transparent policy, require consent where applicable, limit access to business needs, set retention windows, and separate personal from work data on BYOD.
4) How quickly will we see ROI?
If you target idle, routing, and uptime first, many fleets see meaningful savings within weeks and full payback in roughly a quarter.
5) Which KPIs should we monitor first?
Start with utilization %, idle %, dwell by site, on-time %, empty miles, unplanned downtime, and device health. Tie each KPI to an owner and a specific action plan.