

Transportation managers rely on accurate data to understand fleet performance, control operating costs, improve safety, and make better day-to-day decisions.
Fleet KPIs provide measurable insights into how efficiently vehicles, drivers, and operational processes are performing. When monitored consistently, these metrics can help transportation managers identify inefficiencies, reduce downtime, improve compliance, and support long-term business planning.
The key is not to track every possible metric. It is to focus on the KPIs that are most relevant to fleet performance and business goals.
What Are Fleet KPIs?
Fleet KPIs, or key performance indicators, are measurable values used to evaluate the efficiency, cost, safety, compliance, maintenance, and overall performance of fleet operations.
The most useful fleet KPIs should be directly connected to operational goals and provide actionable information.
For example, a transportation manager focused on reducing fuel expenses may closely monitor fuel cost per mile, MPG, and idle time. A fleet focused on service reliability may prioritize on-time delivery rate, vehicle downtime, and route efficiency.
Why Fleet KPIs Matter
Tracking the right KPIs gives transportation managers a clearer understanding of fleet performance.
Fleet KPIs can help managers:
- Identify operational inefficiencies
- Control operating costs
- Improve vehicle utilization
- Reduce unplanned downtime
- Monitor driver performance
- Improve safety and compliance
- Support better dispatch and route planning
- Measure performance trends over time
Without measurable performance data, it can be difficult to determine whether operational changes are actually improving results.
1. Cost per Mile
Cost per mile is one of the most important fleet performance metrics because it shows how much it costs to operate a vehicle for each mile driven.
This calculation may include:
- Fuel
- Maintenance
- Tires
- Driver costs
- Insurance
- Tolls
- Administrative expenses
Transportation managers can use cost per mile to compare vehicles, routes, and time periods.
A rising cost per mile may indicate increased fuel expenses, higher maintenance costs, poor utilization, or other operational inefficiencies.
2. Fuel Cost per Mile
Fuel cost per mile measures fuel expenses relative to the distance traveled.
This KPI helps transportation managers understand how much fuel is contributing to overall fleet operating costs.
Monitoring fuel cost per mile can help identify:
- Inefficient vehicles
- Routes with excessive idling
- Changes in driver behavior
- Declining fuel efficiency
- Higher-than-expected fuel expenses
Comparing this KPI across vehicles can also help managers identify units that may require further inspection.
3. Miles per Gallon
Miles per gallon, or MPG, is a core fuel-efficiency metric.
It shows how efficiently a vehicle converts fuel into productive mileage.
Several factors can affect MPG, including:
- Vehicle speed
- Idling
- Route conditions
- Load weight
- Driver behavior
- Vehicle condition
Tracking MPG over time can help managers identify unexpected changes in fuel performance.
4. Idle Time Percentage
Idle time percentage measures how much of a vehicle’s operating time is spent idling.
Excessive idling can increase fuel consumption, engine hours, and operating costs without generating productive mileage.
Transportation managers should consider tracking idle percentage instead of only total idle hours because percentages make it easier to compare vehicles with different usage levels.
5. Vehicle Utilization Rate
Vehicle utilization measures how effectively fleet assets are being used.
Depending on the operation, utilization may be calculated based on:
- Active miles compared with available time
- Productive vehicle days
- Revenue-generating miles
- Loads or deliveries completed
Low utilization may indicate excess fleet capacity, inefficient dispatching, or underused vehicles.
Monitoring this KPI can help transportation managers determine whether the fleet size matches actual operational demand.
6. Vehicle Downtime
Vehicle downtime measures how long fleet vehicles are unavailable for productive use.
Downtime can be divided into several categories:
- Planned maintenance
- Unplanned repairs
- Roadside breakdowns
Transportation managers should track both the frequency and duration of downtime.
Frequent or extended downtime can affect vehicle availability, driver productivity, delivery performance, and overall operating costs.
7. Maintenance Cost per Vehicle
Maintenance cost per vehicle shows how much is being spent on repairs and servicing for each fleet unit.
This KPI can help identify vehicles that are becoming increasingly expensive to maintain.
Transportation managers can use maintenance cost data to support:
- Repair decisions
- Vehicle replacement planning
- Preventive maintenance strategies
- Lifecycle management
A vehicle with consistently high maintenance costs may no longer be economically efficient to keep in service.
8. Preventive Maintenance Compliance
Preventive maintenance compliance measures how consistently scheduled maintenance is completed on time.
This may include:
- Oil changes
- Brake inspections
- Tire service
- Fluid checks
- Preventive inspections
- Scheduled component replacements
High preventive maintenance compliance can help reduce unexpected breakdowns and improve vehicle reliability.
9. Breakdown Frequency
Breakdown frequency measures how often vehicles experience unplanned mechanical failures.
A high breakdown rate may indicate:
- Aging vehicles
- Inadequate preventive maintenance
- Recurring mechanical issues
- Poor vehicle condition
Tracking breakdowns by vehicle can help transportation managers identify problem units and maintenance trends.
10. On-Time Delivery Rate
On-time delivery rate measures the percentage of deliveries completed within the expected delivery window.
This KPI can reflect several areas of fleet performance, including:
- Dispatch efficiency
- Route planning
- Vehicle reliability
- Driver availability
- Customer service performance
A declining on-time delivery rate may indicate broader operational problems that require investigation.
11. Average Delivery Delay
Average delivery delay measures how late delayed deliveries are, on average.
This metric adds context to the on-time delivery rate.
For example, two fleets may have the same percentage of late deliveries, but one may average 10-minute delays while the other averages 60-minute delays.
Tracking both metrics provides a more complete picture of delivery performance.
12. Driver Hours Utilization
Driver hours utilization measures how effectively available driver time is being used.
Transportation managers can compare available Hours of Service with actual productive driving time.
This may help identify:
- Scheduling inefficiencies
- Excessive waiting time
- Dispatching problems
- Poor route planning
Better use of available driver hours can improve productivity without increasing driver workload.
13. Hours of Service Violations
Hours of Service violations are an important compliance KPI for fleets subject to HOS regulations.
Transportation managers should monitor:
- Violation frequency
- Recurring driver issues
- Scheduling patterns
- Dispatch-related causes
Tracking HOS violations can help identify where additional coaching, training, or operational changes may be needed.
14. Safety Event Rate
Safety event rate measures the frequency of driving behaviors or events that may indicate elevated risk.
Examples include:
- Harsh braking
- Speeding
- Rapid acceleration
- Sharp cornering
- Distracted-driving events
Tracking safety events per mile, per driver, or per trip is often more useful than looking only at raw totals.
This creates more meaningful comparisons across drivers and vehicles.
15. Preventable Accident Rate
Preventable accident rate measures the frequency of incidents that could potentially have been avoided.
Transportation managers can review these incidents by:
- Driver
- Vehicle
- Route
- Location
- Time period
This helps identify recurring safety patterns and opportunities for targeted driver coaching.
16. Inspection Defect Rate
Inspection defect rate measures how frequently defects are reported during DVIRs or other vehicle inspections.
Recurring defects may indicate:
- Maintenance issues
- Aging equipment
- Inadequate preventive maintenance
- Repeated component failures
Monitoring defect trends can help maintenance teams address recurring problems more effectively.
17. Fuel Exception Rate
Fuel exception rate tracks unusual or potentially suspicious fuel activity.
Examples may include:
- Unexpected fuel purchase locations
- Unusual fuel volumes
- Fuel-card and vehicle mismatches
- Significant MPG changes
This KPI can help transportation managers identify potential inefficiencies, errors, or unauthorized activity.
18. Route Efficiency
Route efficiency measures how closely actual route performance matches planned operations.
Transportation managers may evaluate:
- Planned vs. actual miles
- Route deviations
- Empty miles
- Unplanned stops
- Travel time
Improved route efficiency can help reduce mileage, fuel consumption, and delivery delays.
19. Empty Miles Percentage
Empty miles, also known as deadhead miles, are miles driven without a revenue-generating load.
A high percentage of empty miles can reduce fleet efficiency and increase operating costs.
Tracking this KPI can help managers improve load planning, route coordination, and vehicle utilization.
20. Revenue or Productivity per Vehicle
Revenue or productivity per vehicle measures the operational output generated by each fleet asset.
Depending on the business model, this may include:
- Revenue per truck
- Loads per vehicle
- Productive miles
- Deliveries per day
This KPI can help transportation managers compare asset performance and identify underused vehicles.
Fleet KPI Summary Table
| Fleet KPI | What It Measures | Why It Matters |
|---|---|---|
| Cost per mile | Total operating cost per mile | Tracks overall fleet efficiency |
| Fuel cost per mile | Fuel expense per mile | Helps control fuel-related costs |
| MPG | Fuel efficiency | Identifies fuel performance trends |
| Idle percentage | Time spent idling | Highlights fuel waste |
| Vehicle utilization | Productive use of fleet assets | Identifies underused vehicles |
| Vehicle downtime | Time vehicles are unavailable | Measures fleet availability |
| Maintenance cost per vehicle | Repair and service costs | Supports lifecycle decisions |
| Preventive maintenance compliance | Completion of scheduled maintenance | Helps reduce breakdown risk |
| On-time delivery rate | Delivery reliability | Measures service performance |
| HOS violations | Compliance performance | Helps reduce regulatory risk |
| Safety event rate | Driver risk patterns | Supports safety coaching |
| Empty miles percentage | Non-revenue mileage | Highlights routing inefficiency |
How Often Should Fleet KPIs Be Reviewed?
Different KPIs should be reviewed at different intervals.
Daily
Daily monitoring may include:
- Vehicle status
- HOS issues
- Safety events
- Route delays
- Fuel exceptions
These metrics often require immediate action.
Weekly
Weekly reviews may include:
- Idle time
- MPG
- Vehicle utilization
- Delivery performance
- Driver trends
These metrics help managers identify short-term patterns.
Monthly
Monthly reviews may include:
- Cost per mile
- Maintenance costs
- Vehicle downtime
- Safety rates
- Asset performance
These KPIs provide a broader view of operational performance.
Quarterly
Quarterly reviews are useful for strategic decisions, including:
- Vehicle replacement
- Fleet size
- Budget performance
- Long-term performance trends
- Asset lifecycle planning
How to Choose the Right Fleet KPIs
Transportation managers do not need to track every possible metric.
The most useful KPIs should reflect the fleet’s specific goals and operating environment.
Managers should consider:
- Business goals
- Fleet size
- Type of operation
- Customer requirements
- Compliance priorities
- Cost structure
For example, a long-haul carrier may prioritize fuel efficiency, HOS compliance, and cost per mile, while a local delivery fleet may focus more heavily on route efficiency, idle time, and on-time delivery.
Common Fleet KPI Mistakes
Tracking KPIs is useful only when the data leads to better decisions.
Tracking Too Many Metrics
Monitoring too many metrics can make dashboards difficult to interpret.
Focus on KPIs that directly support business objectives.
Focusing on Raw Numbers Without Context
A high number is not always bad, and a low number is not always good.
Metrics should be compared with mileage, vehicle type, route conditions, and historical trends.
Comparing Different Vehicle Types Directly
Different vehicle classes may have very different performance expectations.
KPIs should be compared within relevant vehicle categories.
Ignoring Trend Data
A single data point provides limited insight.
Transportation managers should review changes over time.
Not Connecting KPIs to Action
Collecting data without acting on it creates little operational value.
Each KPI should support a decision, investigation, or improvement initiative.
Using Inconsistent Data Sources
Inconsistent or fragmented data can reduce reporting accuracy.
Using connected systems can help create more reliable KPI tracking.
How Fleet Technology Makes KPI Tracking Easier
Modern fleet technology can automate the collection of operational data.
Connected systems may combine:
- ELD data
- GPS tracking
- Telematics
- DVIRs
- Maintenance records
- Fuel information
- Driver safety events
This reduces the need for manual reporting and gives transportation managers more accurate, up-to-date information.
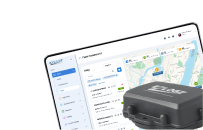
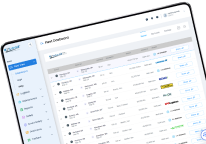
Fleet dashboards can also make it easier to identify trends, compare vehicles, and monitor performance across the organization.
How EZLOGZ Supports Fleet Performance Monitoring
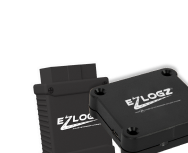
EZLOGZ provides connected fleet technology designed to help transportation managers monitor key areas of fleet operations.
Relevant capabilities may include:
- ELD and Hours of Service management
- GPS tracking
- Fleet monitoring
- Digital DVIRs
- Fuel-related workflows
- Driver safety information
- Asset tracking
- Fleet reporting
By bringing operational information together, transportation managers can gain better visibility into fleet performance and spend less time manually collecting data from separate systems.
Connected data can also make it easier to identify problems, compare performance, and make more informed operational decisions.
Final Thoughts
Fleet KPIs give transportation managers a measurable way to understand how effectively their fleet is operating.
The goal is not to collect as many metrics as possible.
The goal is to monitor the indicators that help improve cost control, safety, compliance, vehicle utilization, maintenance, and customer service.
Metrics such as cost per mile, MPG, vehicle utilization, downtime, on-time delivery rate, safety event rate, and HOS violations can provide valuable insight into daily operations.
When fleet data is accurate, connected, and reviewed consistently, transportation managers can make better decisions and identify opportunities for continuous improvement.
FAQ:
Some of the most important fleet KPIs include cost per mile, fuel efficiency, vehicle utilization, downtime, maintenance cost per vehicle, on-time delivery rate, safety event rate, and Hours of Service violations. The right KPIs depend on the fleet’s operating model and business goals.
Fleet cost per mile is typically calculated by dividing total operating expenses by the total number of miles driven during the same period. Expenses may include fuel, maintenance, tires, insurance, driver costs, tolls, and administrative expenses.
Useful cost-related KPIs include cost per mile, fuel cost per mile, MPG, idle percentage, maintenance cost per vehicle, vehicle utilization, and empty miles percentage. Monitoring these metrics can help managers identify areas where operating expenses may be reduced.
Some KPIs should be monitored daily, such as HOS issues, safety events, route delays, and vehicle status. Fuel efficiency and utilization may be reviewed weekly, while cost per mile, maintenance expenses, downtime, and long-term performance trends are often better reviewed monthly or quarterly.
Common fleet safety KPIs include speeding events, harsh braking, rapid acceleration, preventable accident rate, distracted-driving events, and inspection defect frequency. Tracking these metrics over time can help identify recurring risk patterns and coaching opportunities.
Fleet technology can automatically collect data from ELDs, GPS tracking, telematics, DVIRs, maintenance systems, fuel records, and safety events. This can reduce manual reporting and give transportation managers more accurate and up-to-date performance data.
A fleet metric is any measurable data point related to fleet operations. A fleet KPI is a metric that is directly connected to an important business or operational goal, such as reducing costs, improving safety, increasing utilization, or improving delivery performance.